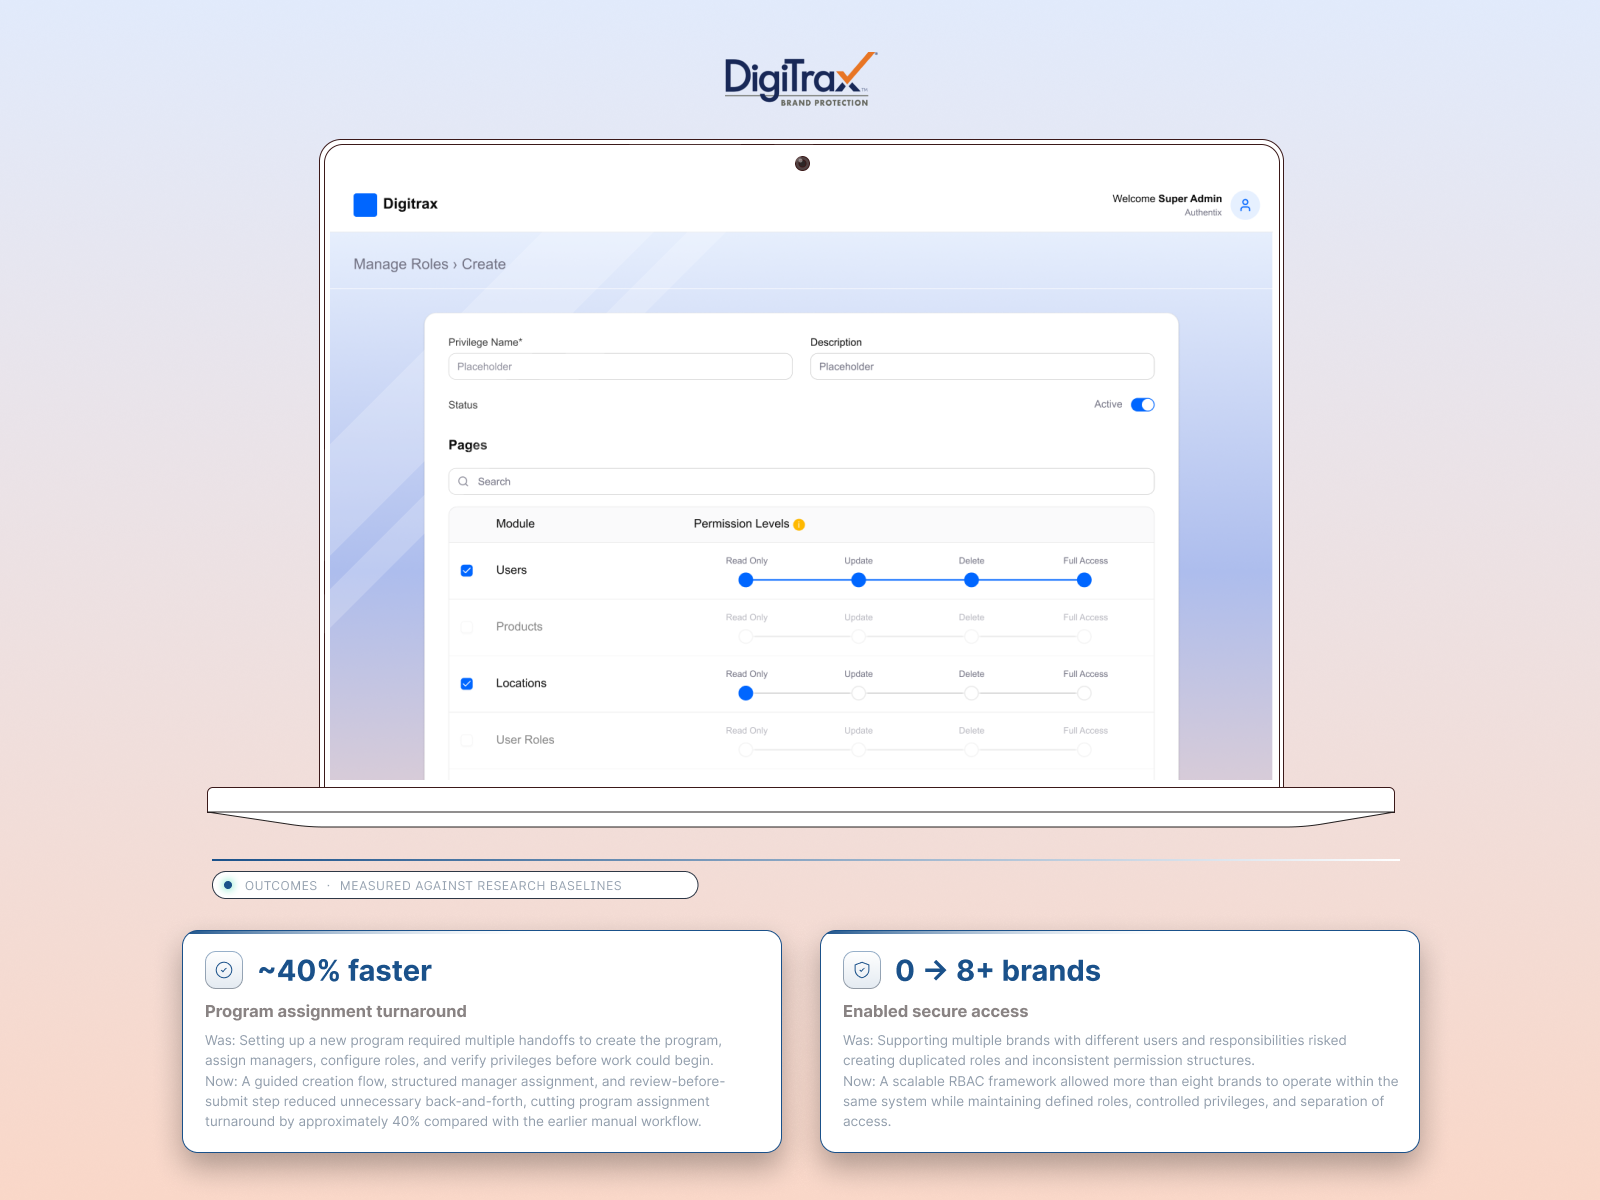
Authentix USA needed a multi-tenant stamp management system to serve 8+ global brands, built by Techlogix.


MY ROLE
As a sole UX designer, I led discovery, interface design, user story mapping, and validation.
DESIGN RATIONALE
The design rationale focused on building guardrails into forms, dashboards, and data tables that prevented errors at the point of input rather than catching them after submission.
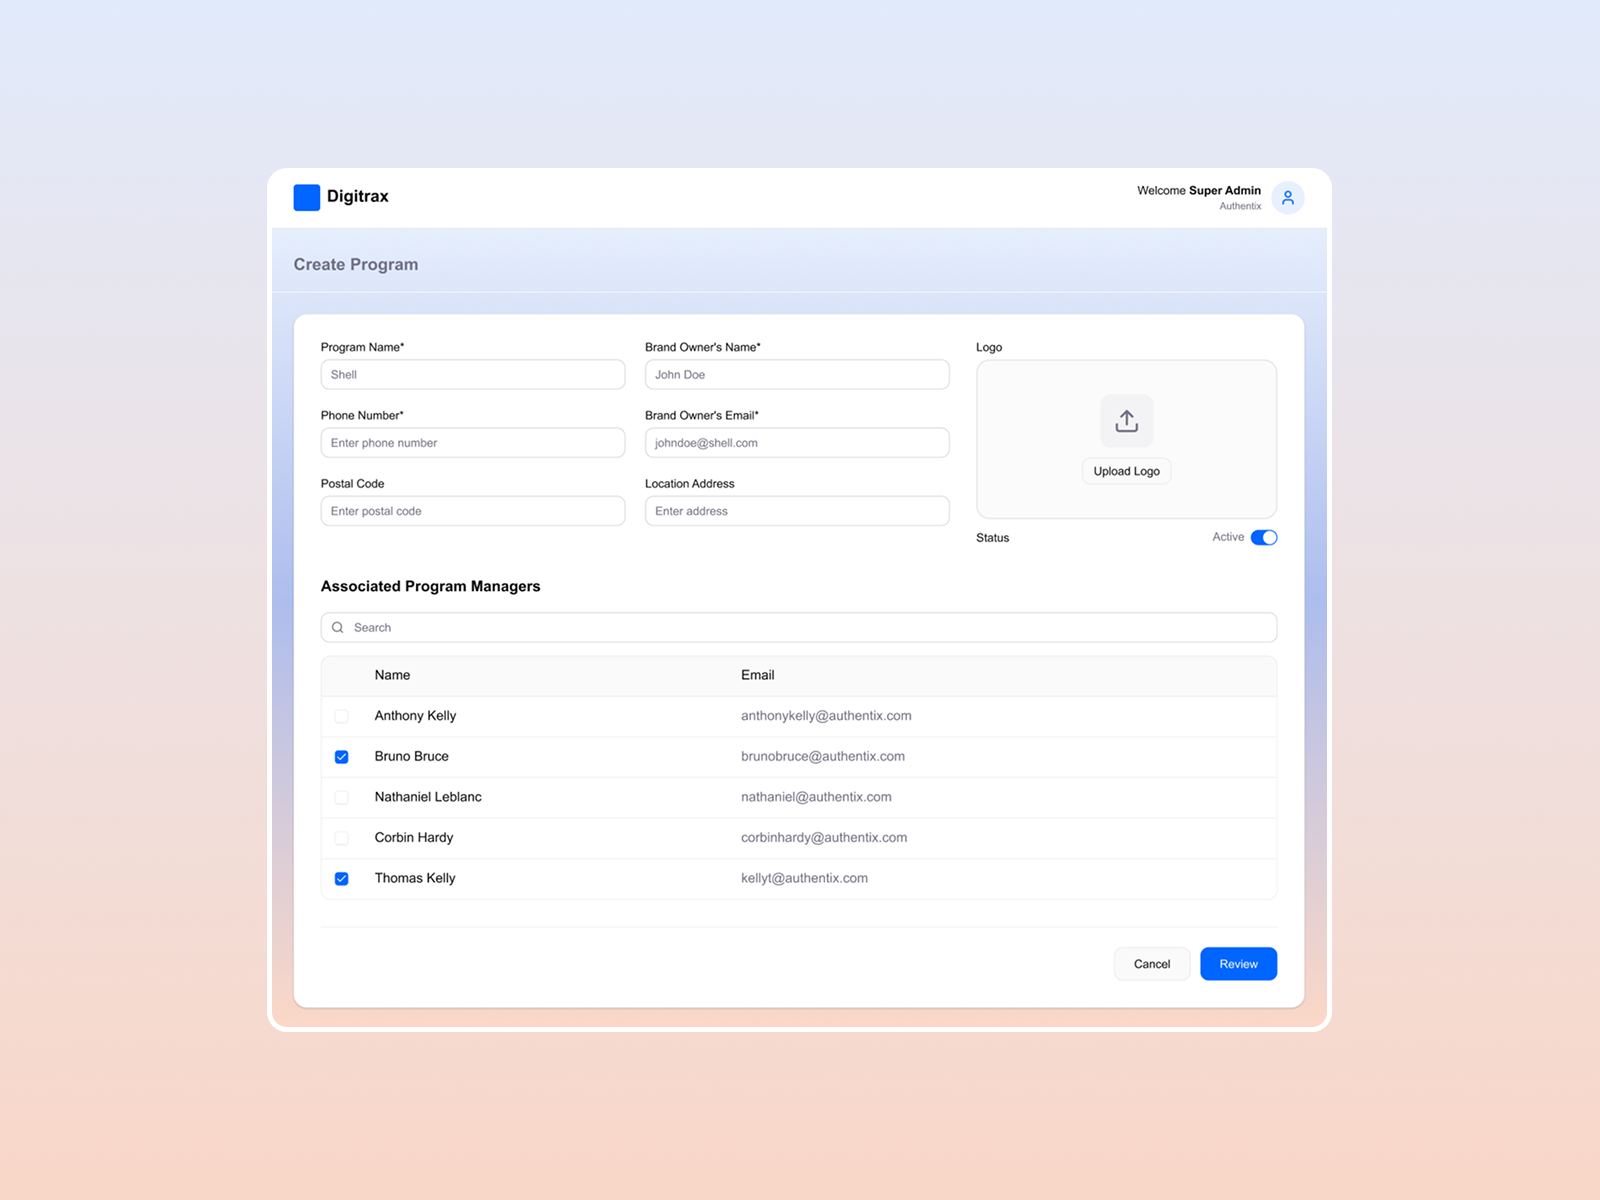
The Create Program form, where super admins onboard a new brand (e.g., Shell) with program name, brand owner details, logo upload, and status toggle. The Associated Program Managers table below lets admins assign specific Authentix team members to the program with a searchable selection. This structured onboarding replaced a manual process that previously contributed to the 40% slower admin onboarding time.
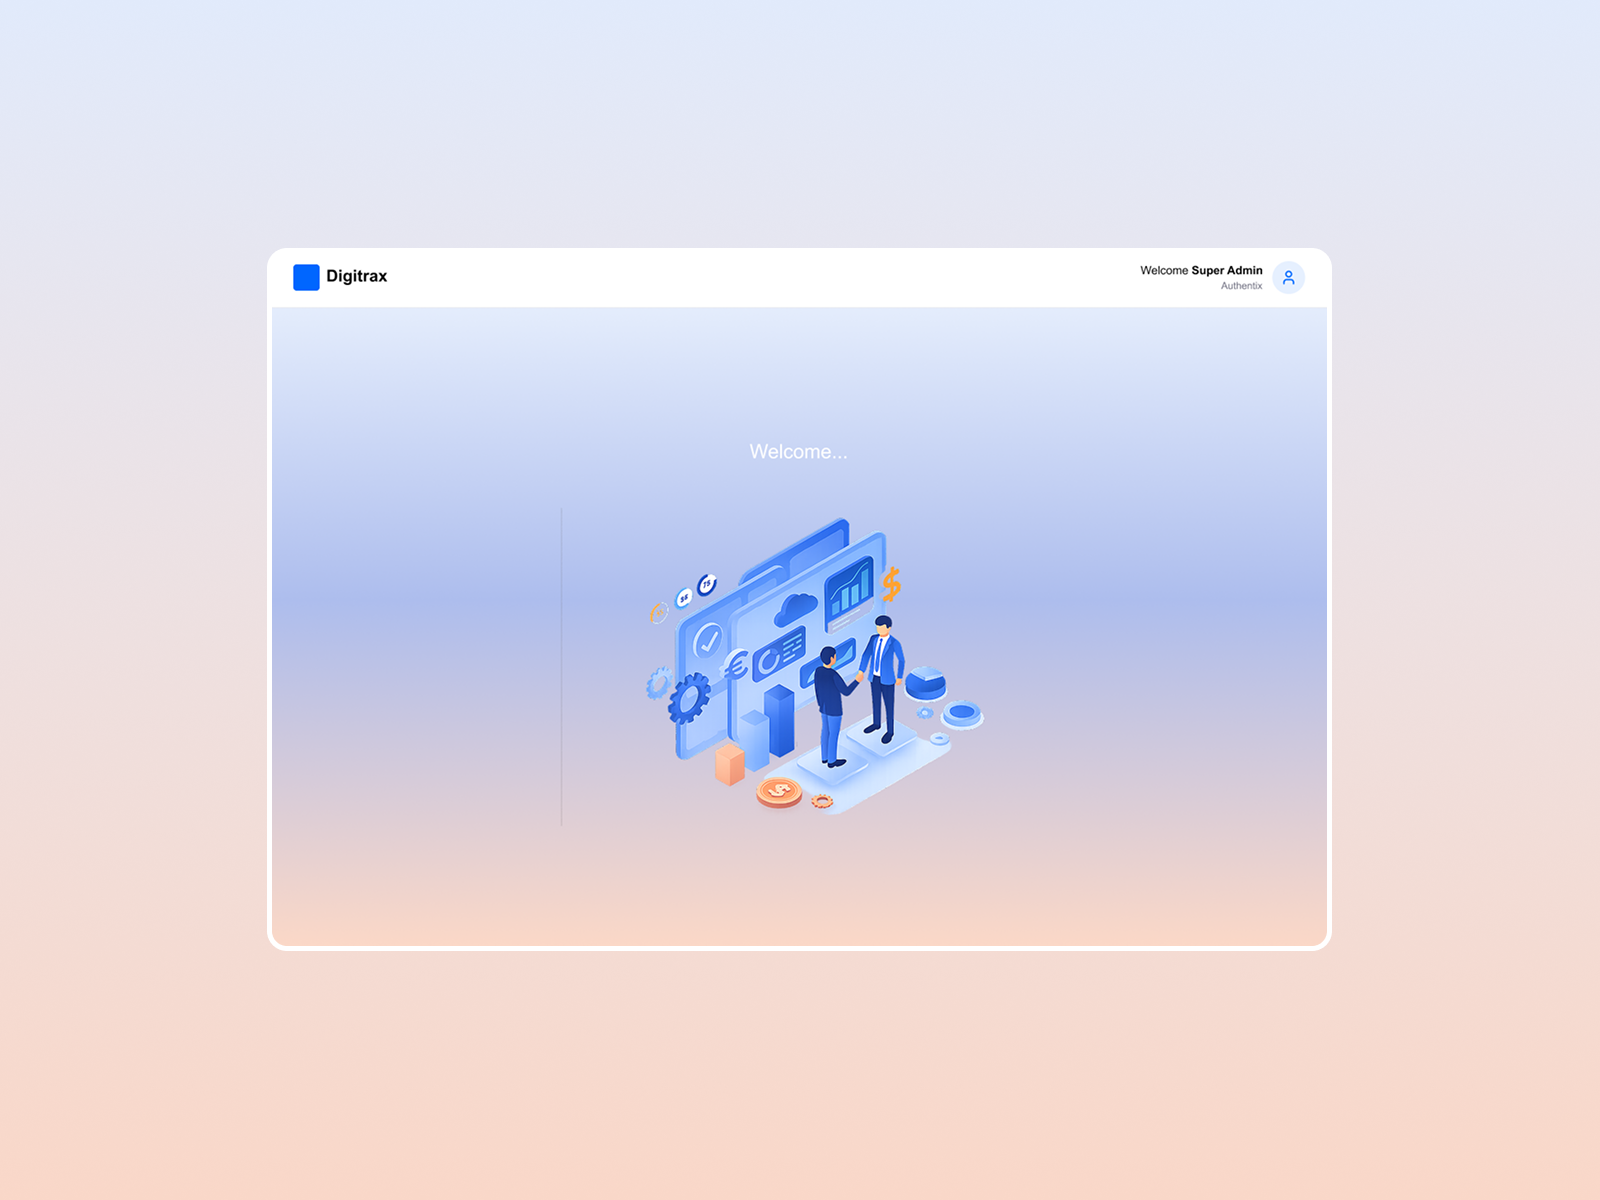
The Digitrax welcome screen for super admins after login shows an illustrated overview of the platform's scope: multi-brand management, data analytics, and cross-program operations. This clean entry point orients admins before they navigate to program-specific workflows.
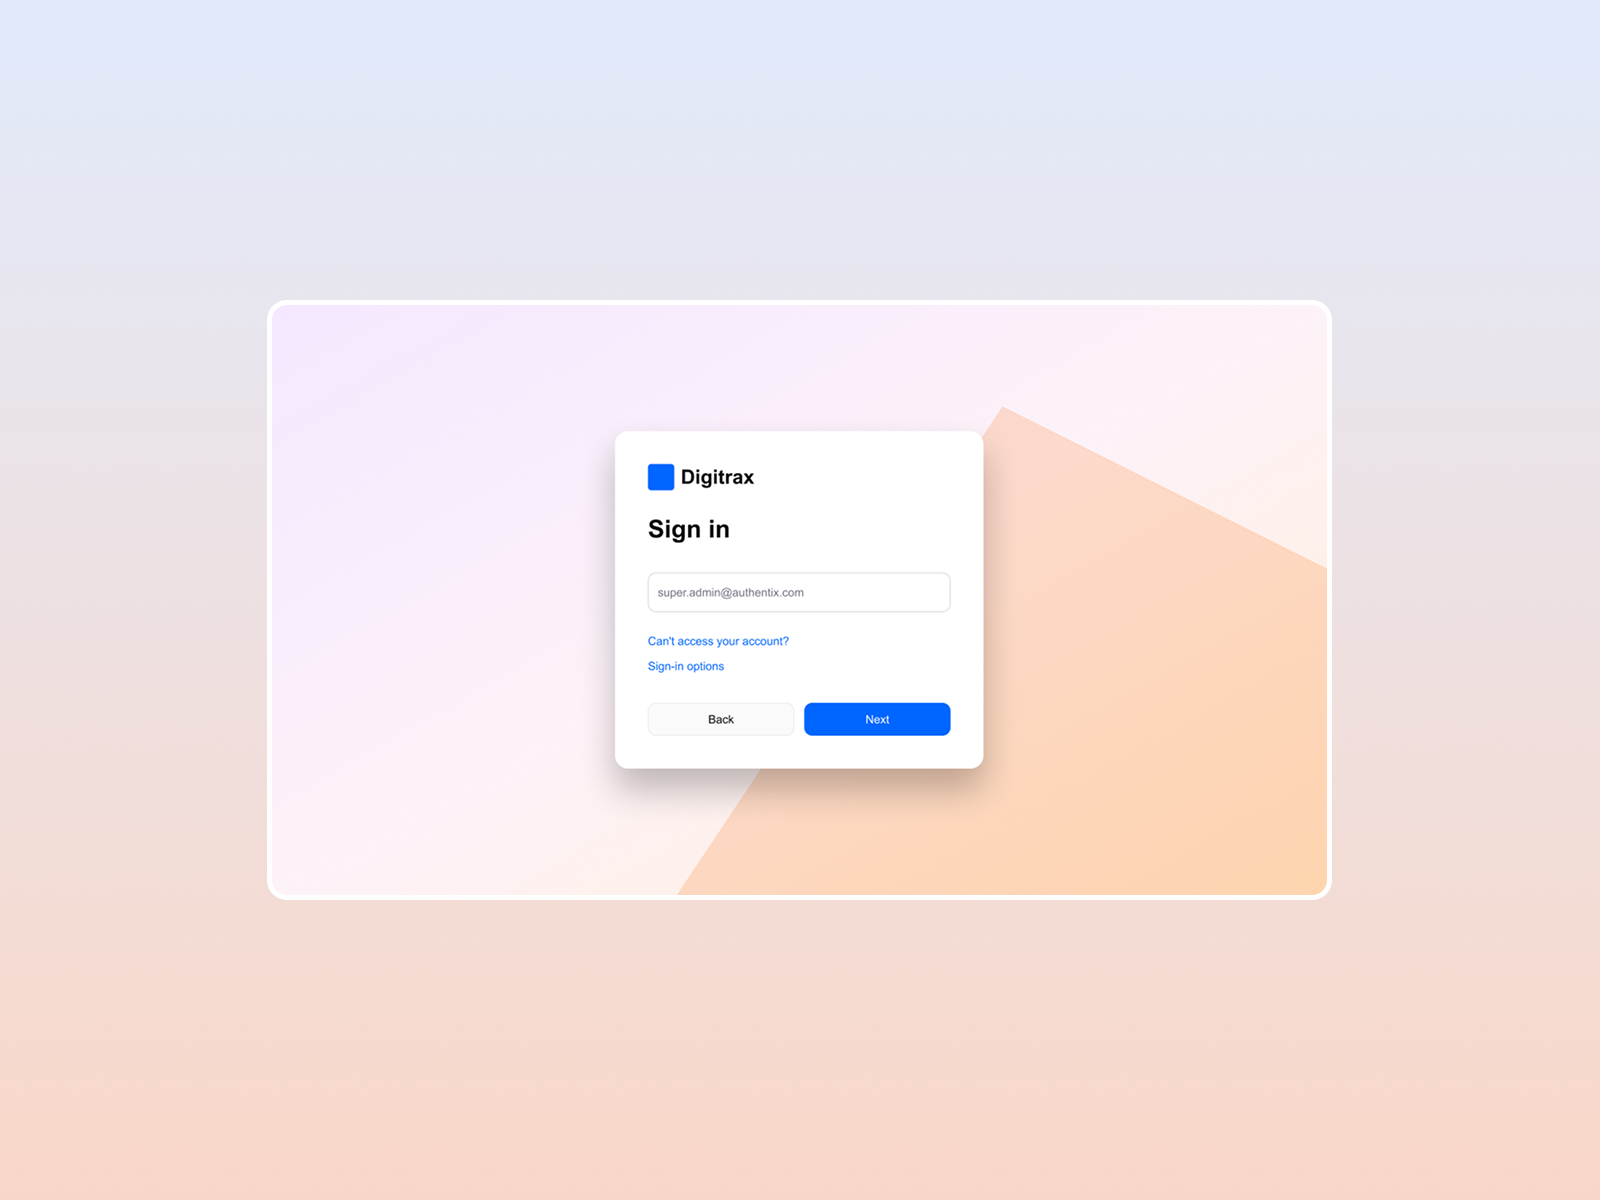
The Digitrax sign-in screen with Authentix-branded email authentication. Clean, minimal login flow with account recovery and sign-in options, serving as the single entry point for admins managing programs across 8+ global brands.
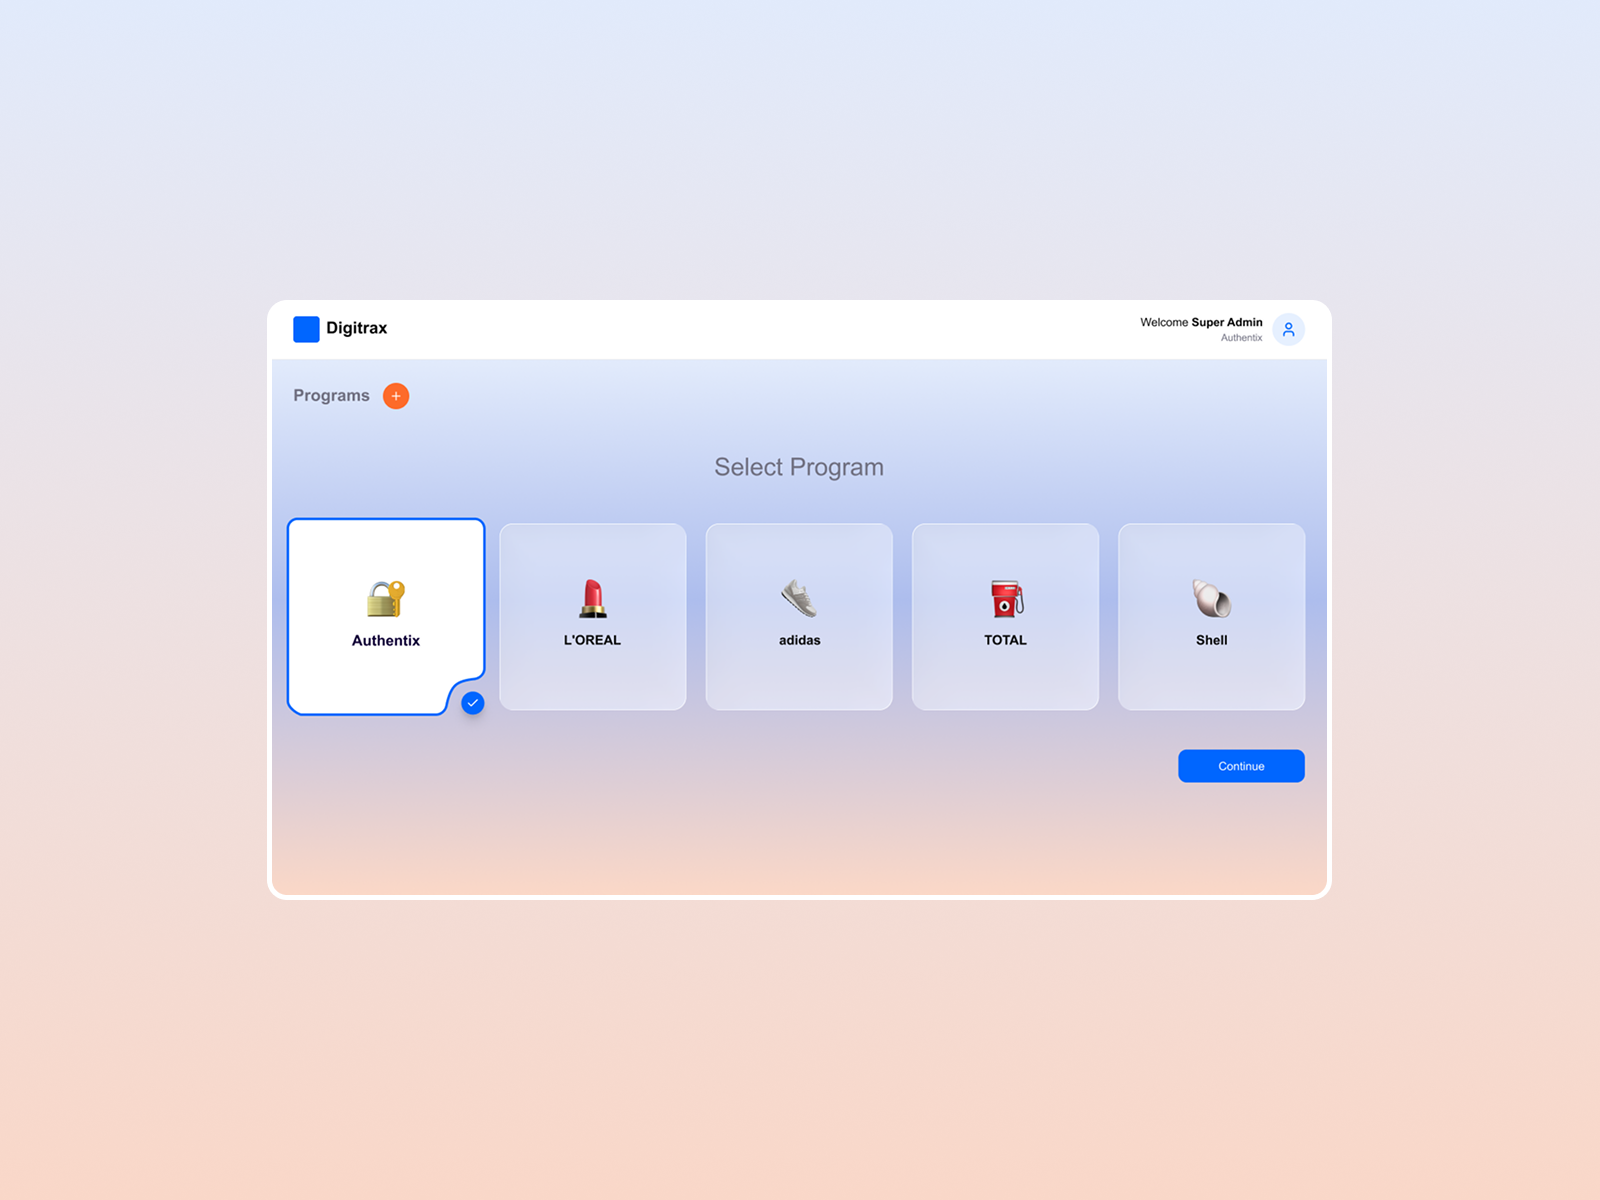
The program selection screen shows the multi-tenant architecture in action. Super admins see all available brand programs—Authentix, L'Oréal, adidas, TOTAL, and Shell—as visual cards and select the program context they want to enter. This pattern enables secure role-based access across 8+ global brands from a single platform, a core requirement for Authentix USA's multi-tenant stamp management system.
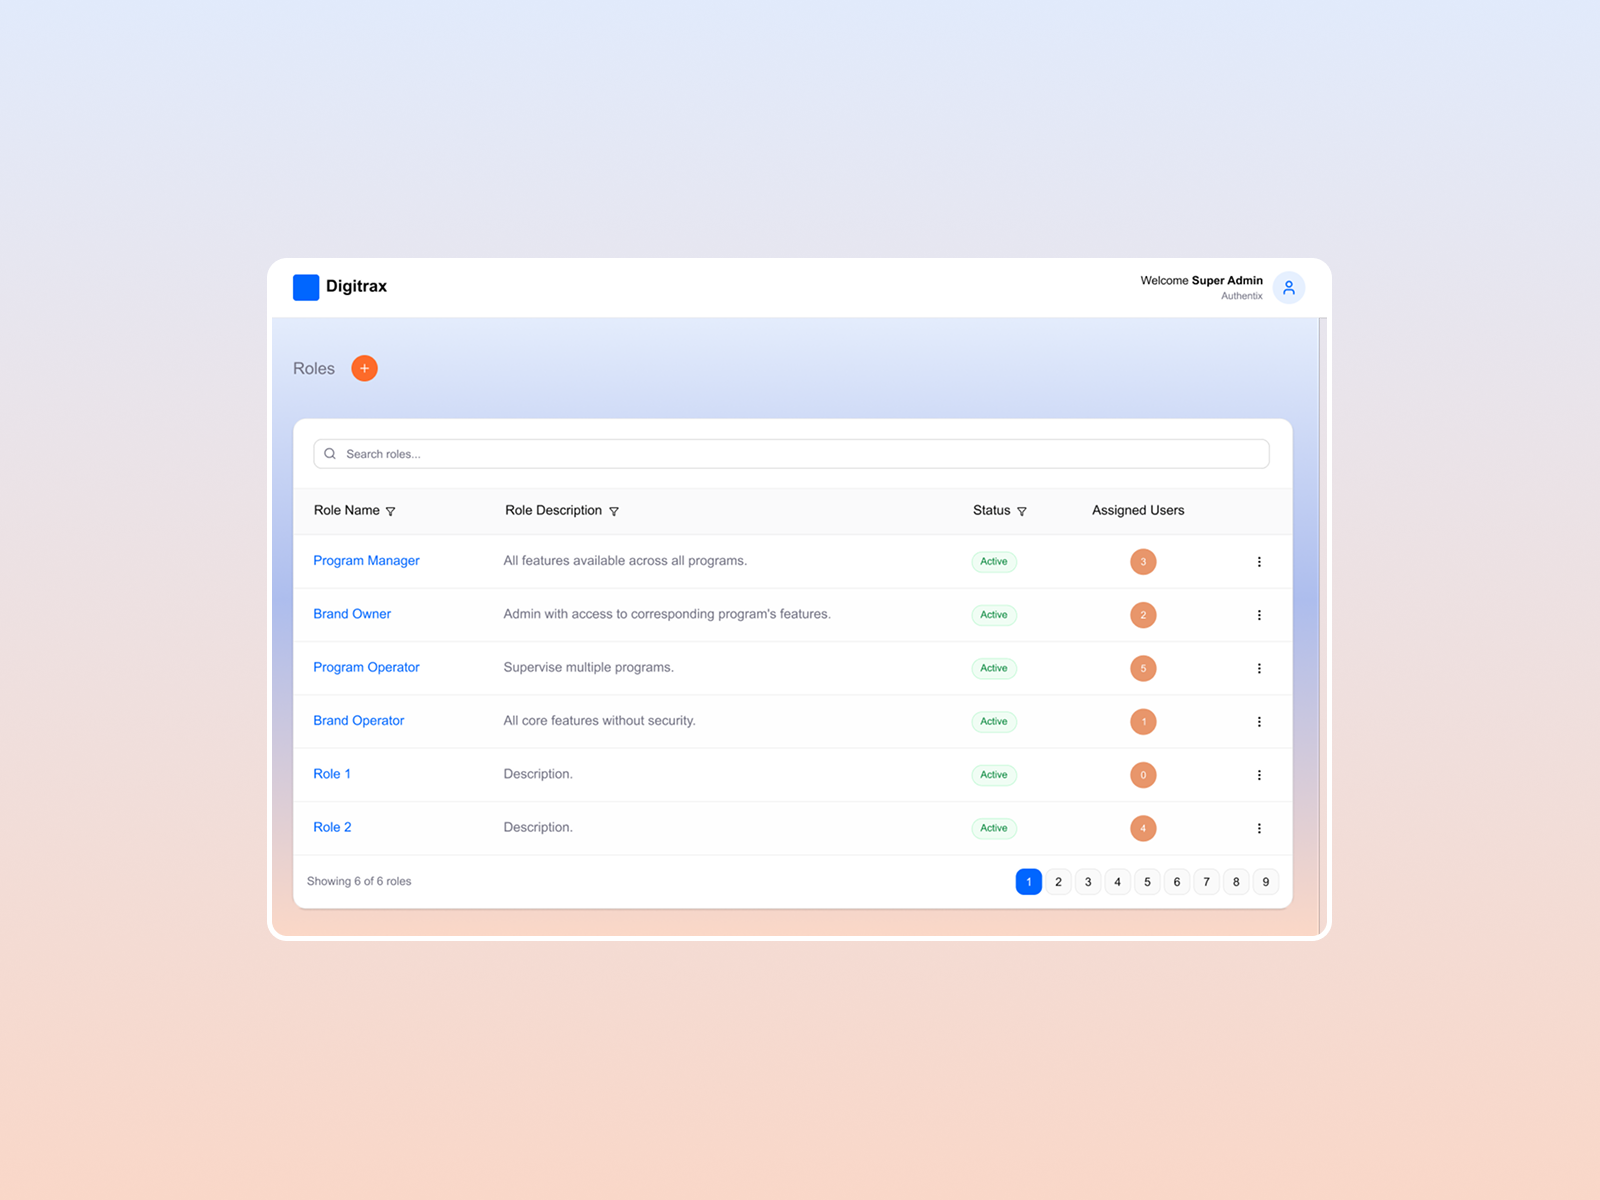
The roles management table shows all defined roles (Program Manager, Brand Owner, Program Operator, Brand Operator) with descriptions, active status, and assigned user counts. Each role name now has a clear description and a visible user assignment, directly addressing the original problem of ambiguous privilege names and the lack of a structured way for admins to understand what each role could do.
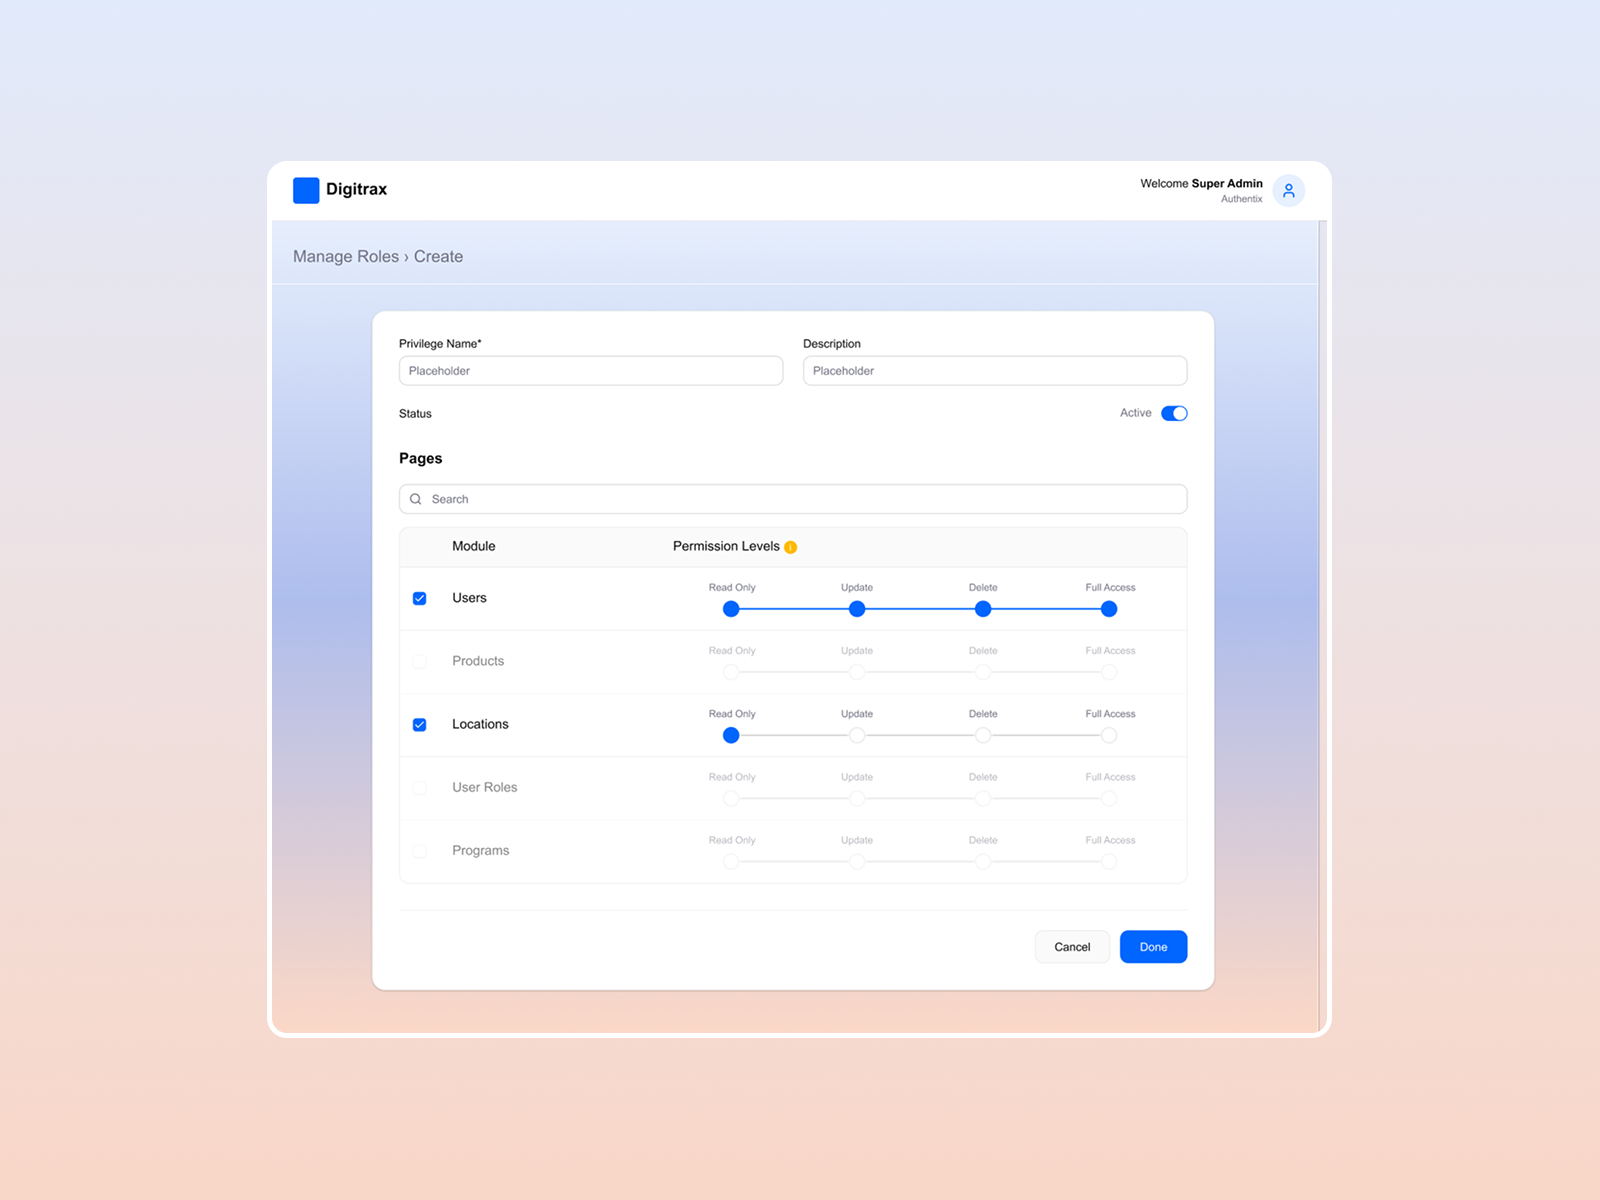
The detailed role-creation view shows per-module permission levels for users, products, locations, user roles, and programs. Each module uses a slider from Read Only to Full Access with visual stops at Update and Delete. Unchecked modules remain completely inactive for that role. This guardrail-based approach prevents misconfiguration at the point of input: admins can see exactly what a role can and cannot do before saving.
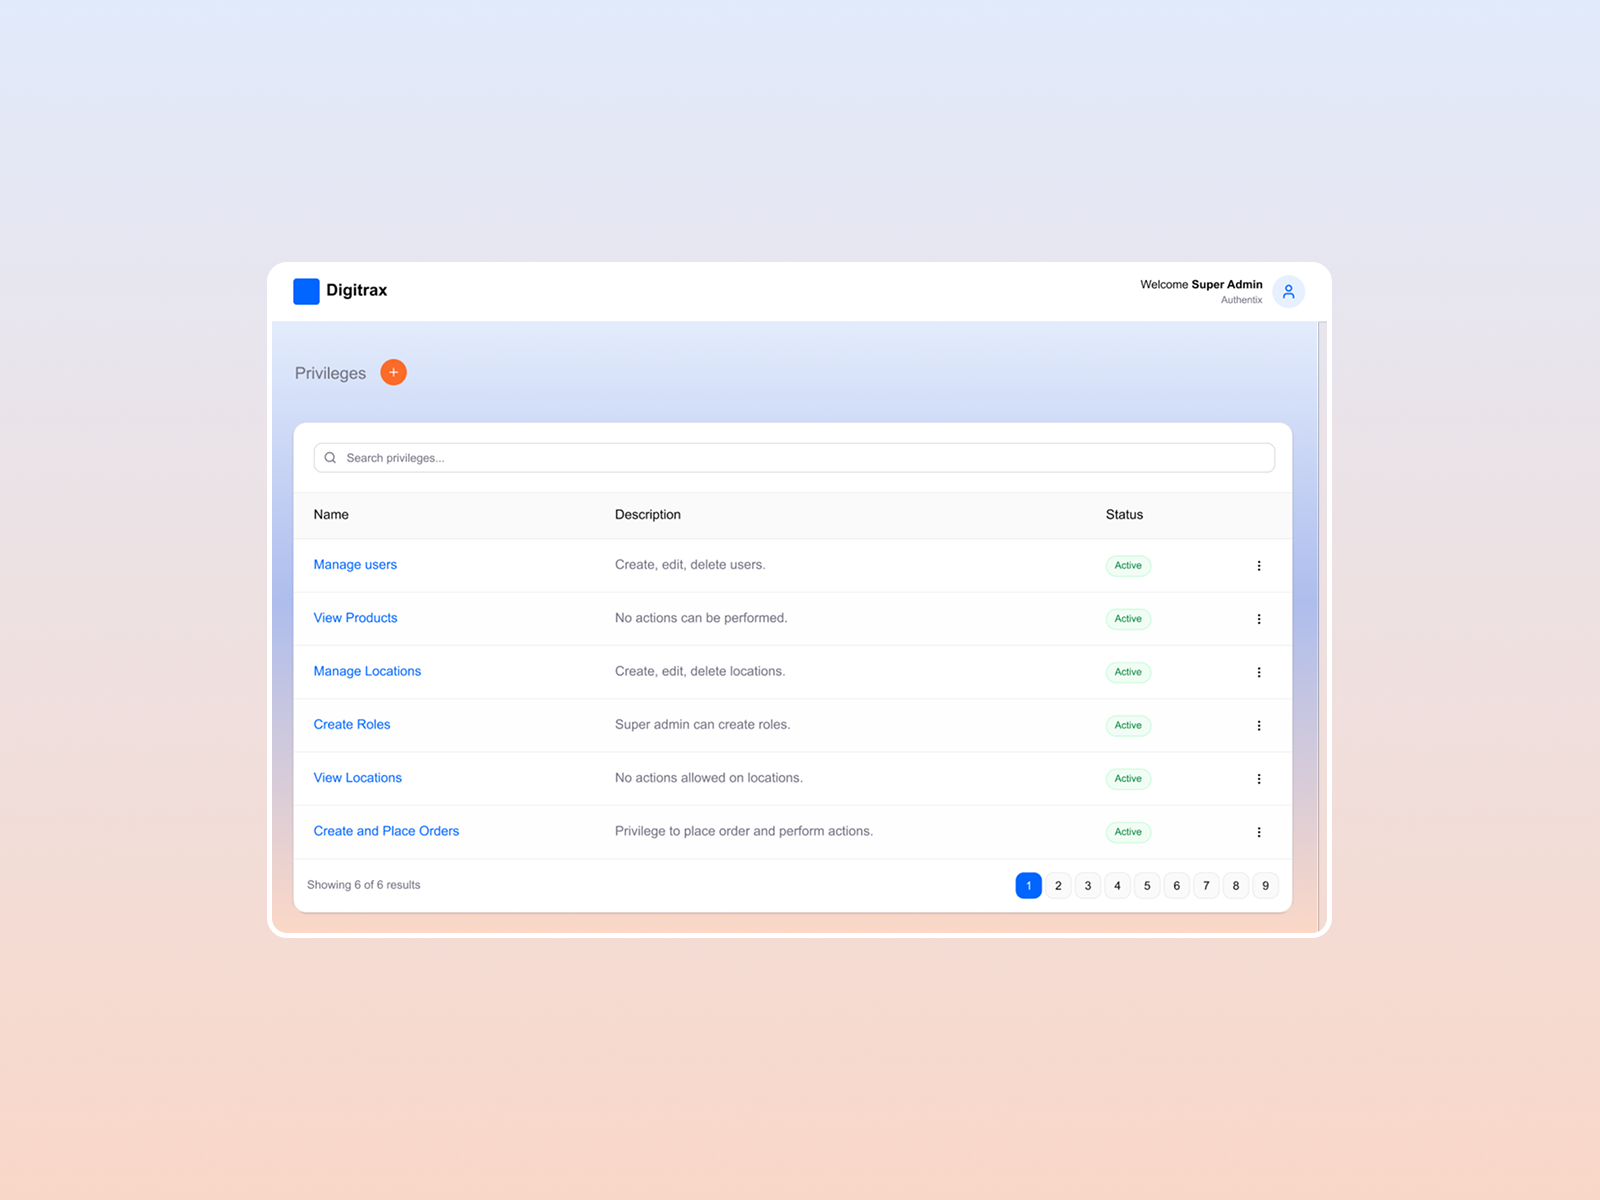
The privileges management table lists all defined privileges (Manage Users, View Products, Manage Locations, Create Roles, View Locations, Create and Place Orders) with plain-language descriptions and active status. Each privilege is an atomic permission unit that can be composed into roles, replacing the previous system in which privilege names were ambiguous and didn't explain the actions they actually permitted.
RESULT
I achieved 40% faster admin onboarding, improved data accuracy, and reduced support calls.
Read the full case study


